
Identification and Determination of Different Wave Components in ECG Signals
Procedure
1. Signal Acquisition
Select a dataset (ECG 1, ECG 2, or ECG 3) from the Input Panel and click Load Raw Signal.
The raw (noisy) signal will appear in the top graph in red.
2. Pre-processing
Click Filter Signal. This applies a Butterworth filter to remove baseline wander and high-frequency noise.
The clean signal (blue) will appear below the raw signal.
3. Signal Analysis
Choose one of the two methods below to identify wave components:
A. Auto Analysis (Algorithmic)
Click Start Auto Analysis. The system will automatically:
- Detect R-peaks with high precision.
- Highlight P-wave (Red), QRS complex (Blue), and T-wave (Green) boundaries.
- Calculate Heart Rate, QRS Duration, and R-R Intervals in the Results Panel.
B. Manual Labelling (Interactive)
Click Start Labelling. You must click the graph 6 times in this exact order:
- P-Wave Onset (Start)
- P-Wave Offset (End)
- QRS Onset (Start)
- QRS Offset (End)
- T-Wave Onset (Start)
- T-Wave Offset (End)
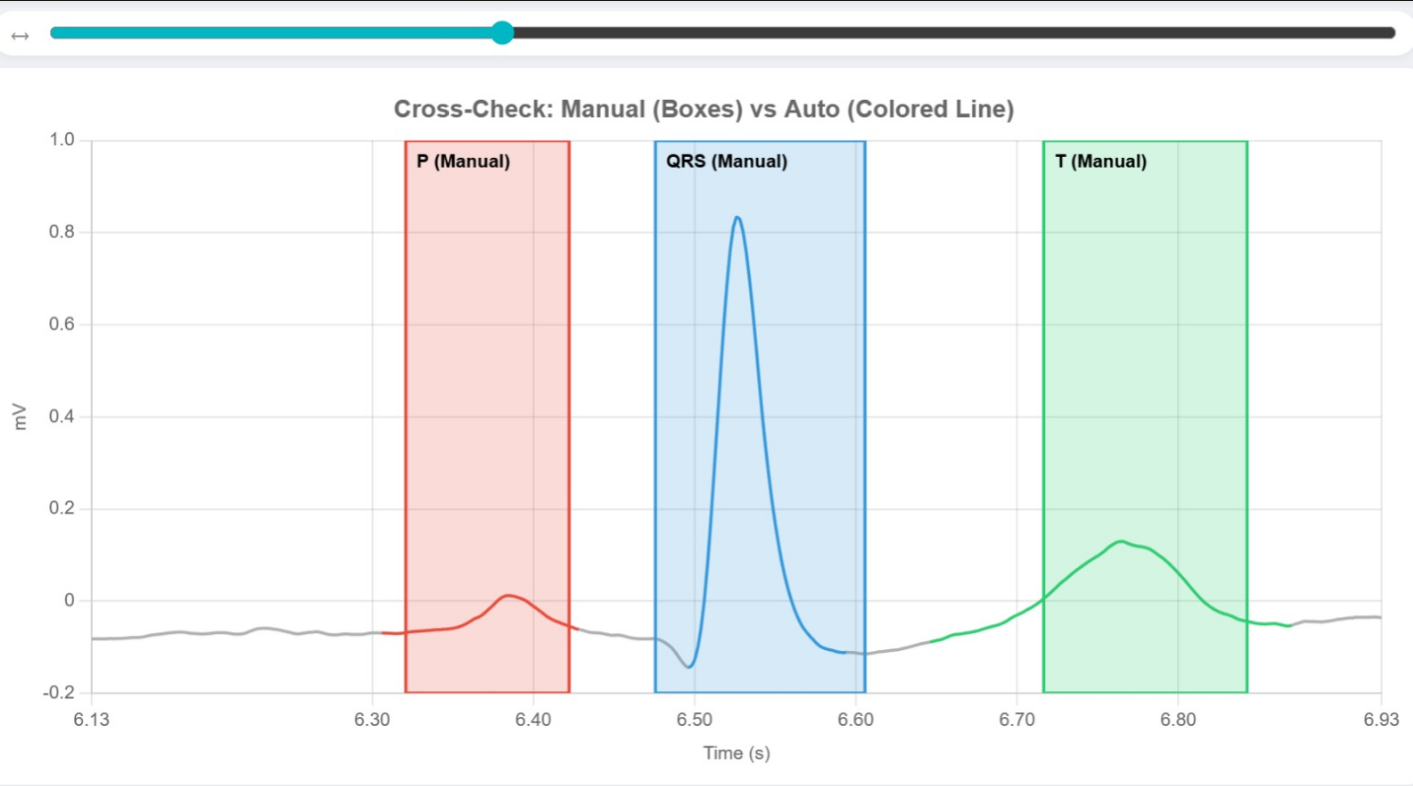
Once finished, a Cross-Check button will appear. Click it to compare your manual marks against the algorithm's detection.
For the above manual labelling, refer to below image:
4. Navigation & Details
Snap-to-Beat: Use the scrollbar to jump between individual heartbeats (Beat 1, Beat 2, etc.).
Hover: Move your mouse over any colored wave component or background segment to see its medical description and duration.
5. Reset
Click Reset to clear all data and start a new experiment.